Data visualization
Design and development of VA of Cloud computing performance
Design
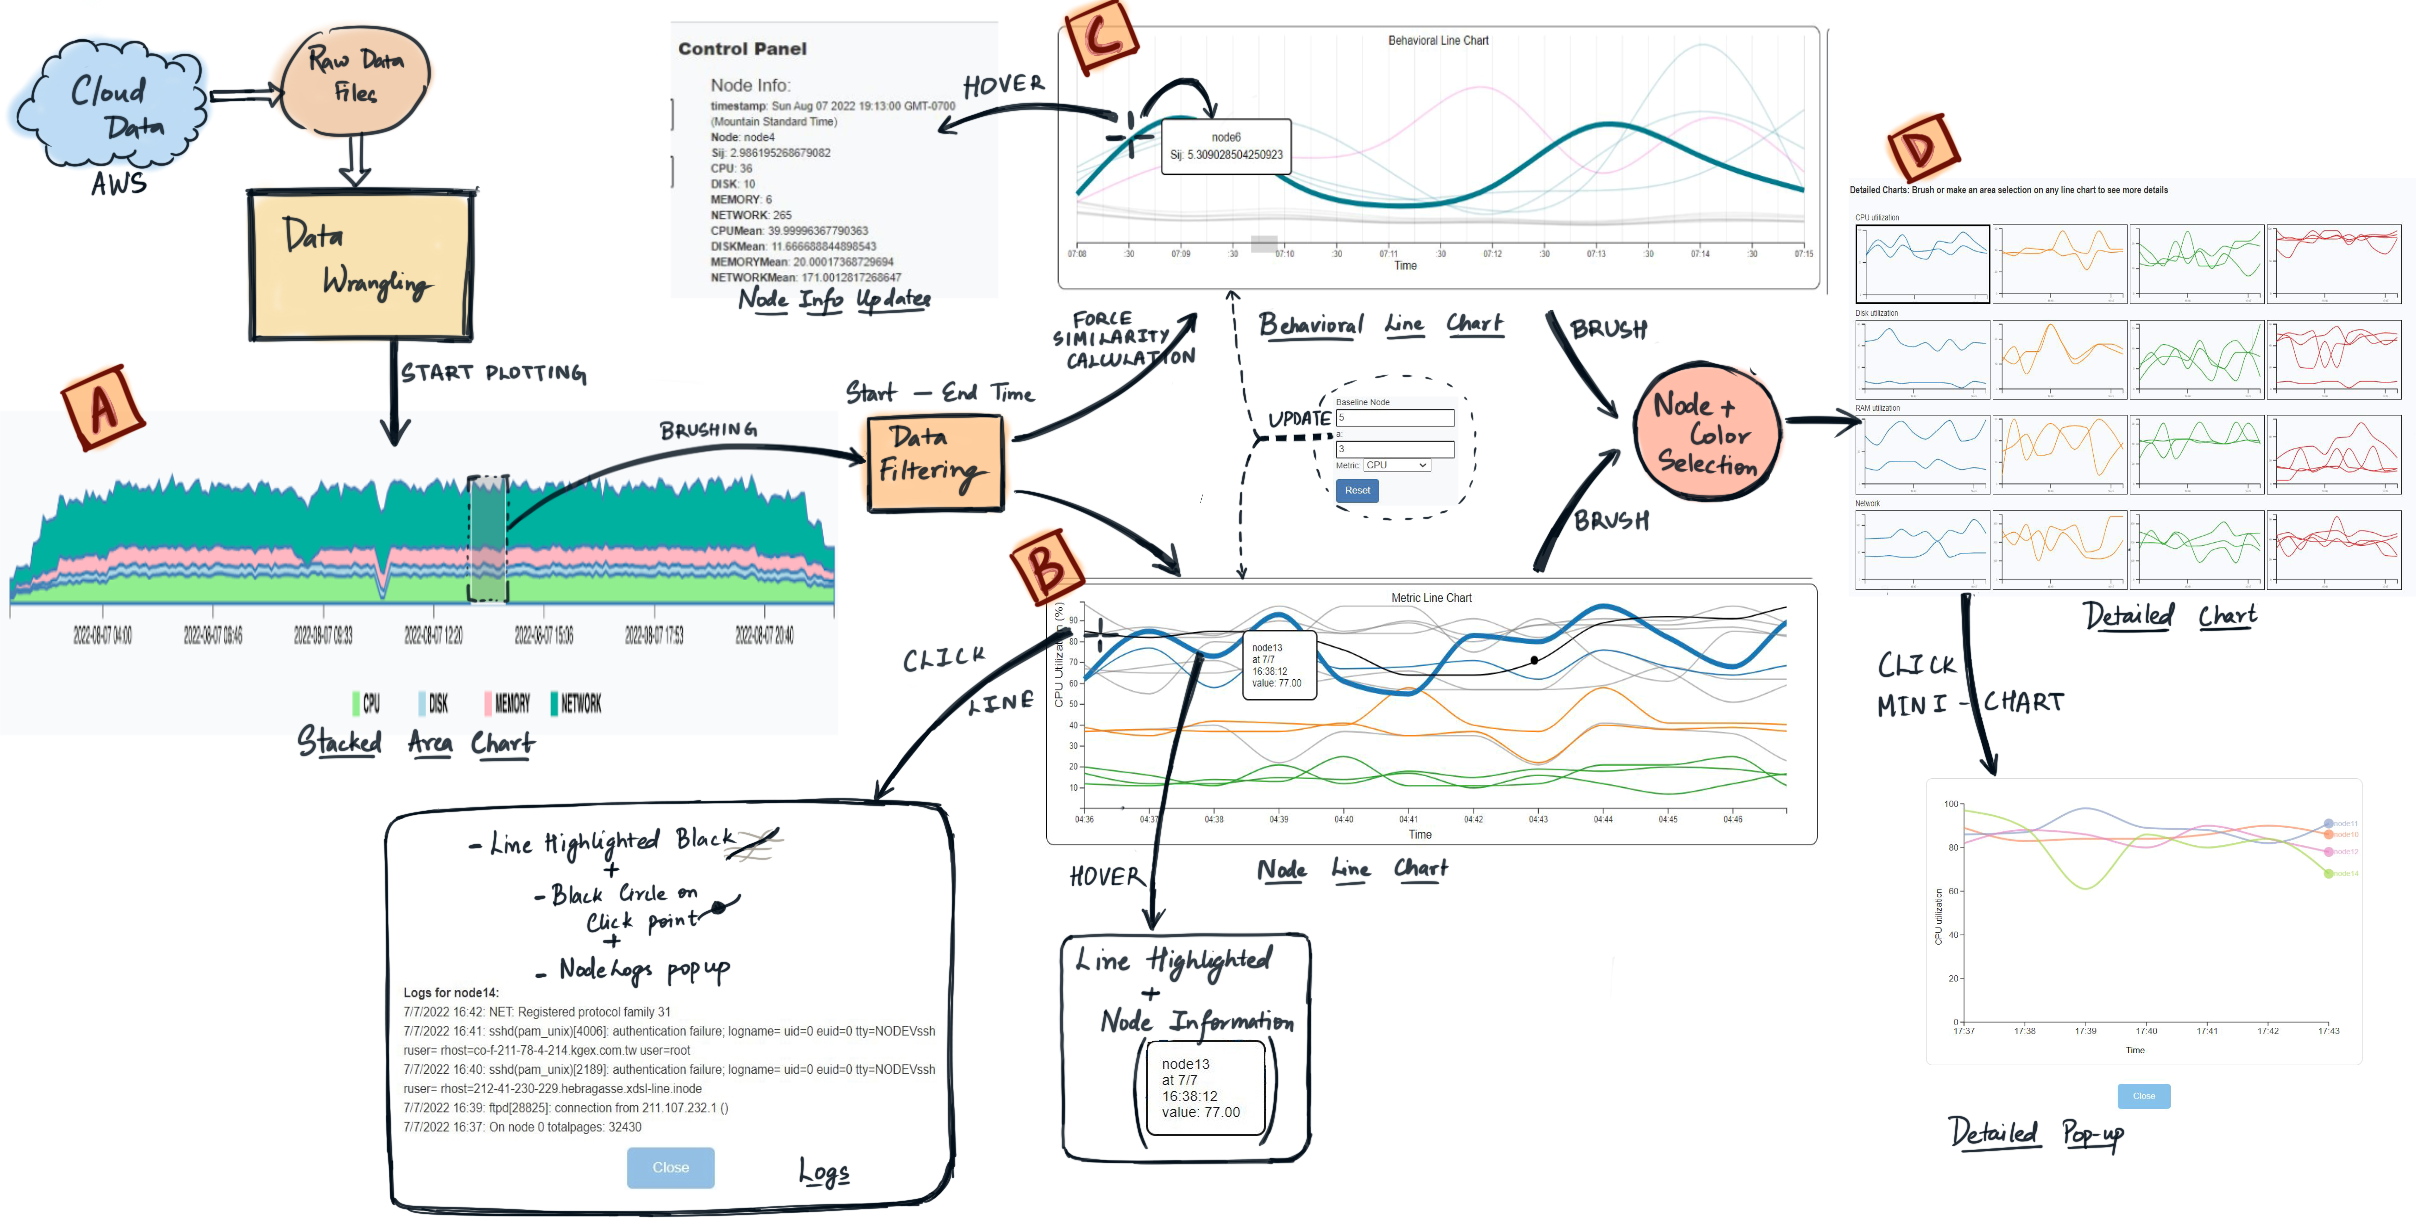
- Data: Cloud data of nodes from AWS
- Stacked area chart: Visual for overall data.
- A stack represent a single attribute.
- x-axis: time
- Brush: select time window for behavioral graph.
- Hover for logs.
- Behavioral graph:
- Control panel:
- Select baseline node for force calculation.
- Select attribute.
- Click for node logs at timestamp.
- Brush: select lines to be plotted into detailed chart for all attributes. (4 selections allowed)
- Control panel:
- Node line chart:
- line graph with actual values.
- Brush: select lines to be plotted into detailed chart for all attributes. (4 selections allowed)
- Detailed chart:
- Line color: Represents selection
- Clickable: popout and plot these lines into individual colors (each representing a node in selection.)
- Popout chart:
- Disernable plot for each node in selection for the selection time.
Result
